This package provides per-day data on COVID-19 cases in Tunisia.
The data is an average over all of the sources provided by Mouna Belaid. Please check out this link.
Using the programming language R, you can install the released version of covid19tunisia with :
data <- refresh_covid19tunisia()

head(data)
#> # A tibble: 6 x 7
  date       location location_type location_code location_code_type data_type value
  <date>     <chr>    <chr>         <chr>         <chr>              <chr>     <dbl>
1 2020-03-02 Gafsa    state         TN-71         iso_3166_2         cases_new     1
2 2020-03-08 Mahdia   state         TN-53         iso_3166_2         cases_new     1
3 2020-03-09 Bizerte  state         TN-23         iso_3166_2         cases_new     1
4 2020-03-09 Mahdia   state         TN-53         iso_3166_2         cases_new     1
5 2020-03-09 Tunis    state         TN-11         iso_3166_2         cases_new     1
6 2020-03-10 Mahdia state TN-53 iso_3166_2 cases_new 1# Transform the data
library(dplyr)
library(tidyr)
library(plotly)
data_transformed <- data %>% group_by(date, data_type) %>% summarise(value = sum(value)) %>%
spread(data_type, value)
head(data_transformed)
# A tibble: 6 x 4
# Groups: date [6]
date cases_new deaths_new recovered_new
<date> <dbl> <dbl> <dbl>
1 2020-03-02 1 0 0
2 2020-03-08 1 0 0
3 2020-03-09 3 0 0
4 2020-03-10 1 0 0
5 2020-03-11 1 0 0
6 2020-03-12 6 0 0
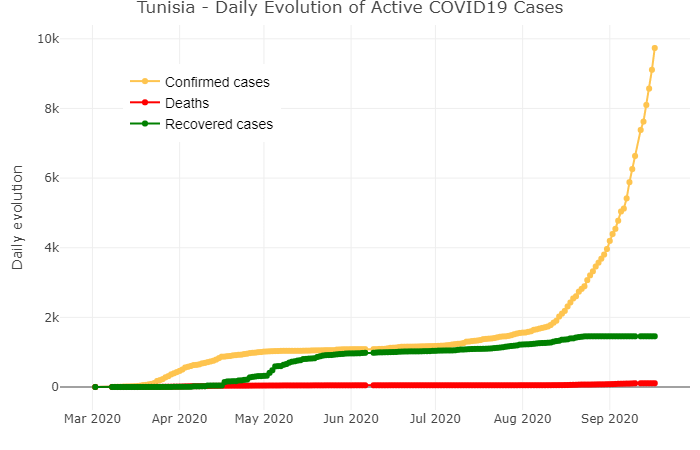
data_transformed %>%
ungroup() %>% plot_ly(type = 'scatter',
mode = 'lines + markers')%>%
add_trace(x = ~date, y = ~cumsum(cases_new),
name = 'Confirmed cases',
marker = list(color = '#fec44f'),
line = list(color = '#fec44f'),
hoverinfo = "text",
text = ~paste(cases_new, "New confirmed cases\n", cumsum(cases_new), 'Total number of infected cases on', date)) %>%
add_trace(x = ~date, y = ~cumsum(deaths_new),
name = 'Deaths',
marker = list(color = 'red'),
line = list(color = 'red'),
hoverinfo = "text",
text = ~paste(deaths_new, "New deaths\n", cumsum(deaths_new), 'Total number of deaths on', date)) %>%
add_trace(x = ~date, y = ~cumsum(recovered_new),
name = 'Recovered cases',
marker = list(color = 'green'),
line = list(color = 'green'),
hoverinfo = "text",
text = ~paste(recovered_new, "New recovered cases\n", cumsum(recovered_new), 'Total number of recovered cases on', date)) %>%
layout(title = 'Tunisia - Daily Evolution of Active COVID19 Cases',
legend = list(x = 0.1, y = 0.9,
font = list(family = "sans-serif", size = 14, color = "#000"), bgcolor = "",
bordercolor = "#FFFFFF", borderwidth = 2),
xaxis = list(title = ""),
yaxis = list(side = 'left', title = 'Daily evolution', showgrid = TRUE, zeroline = TRUE))
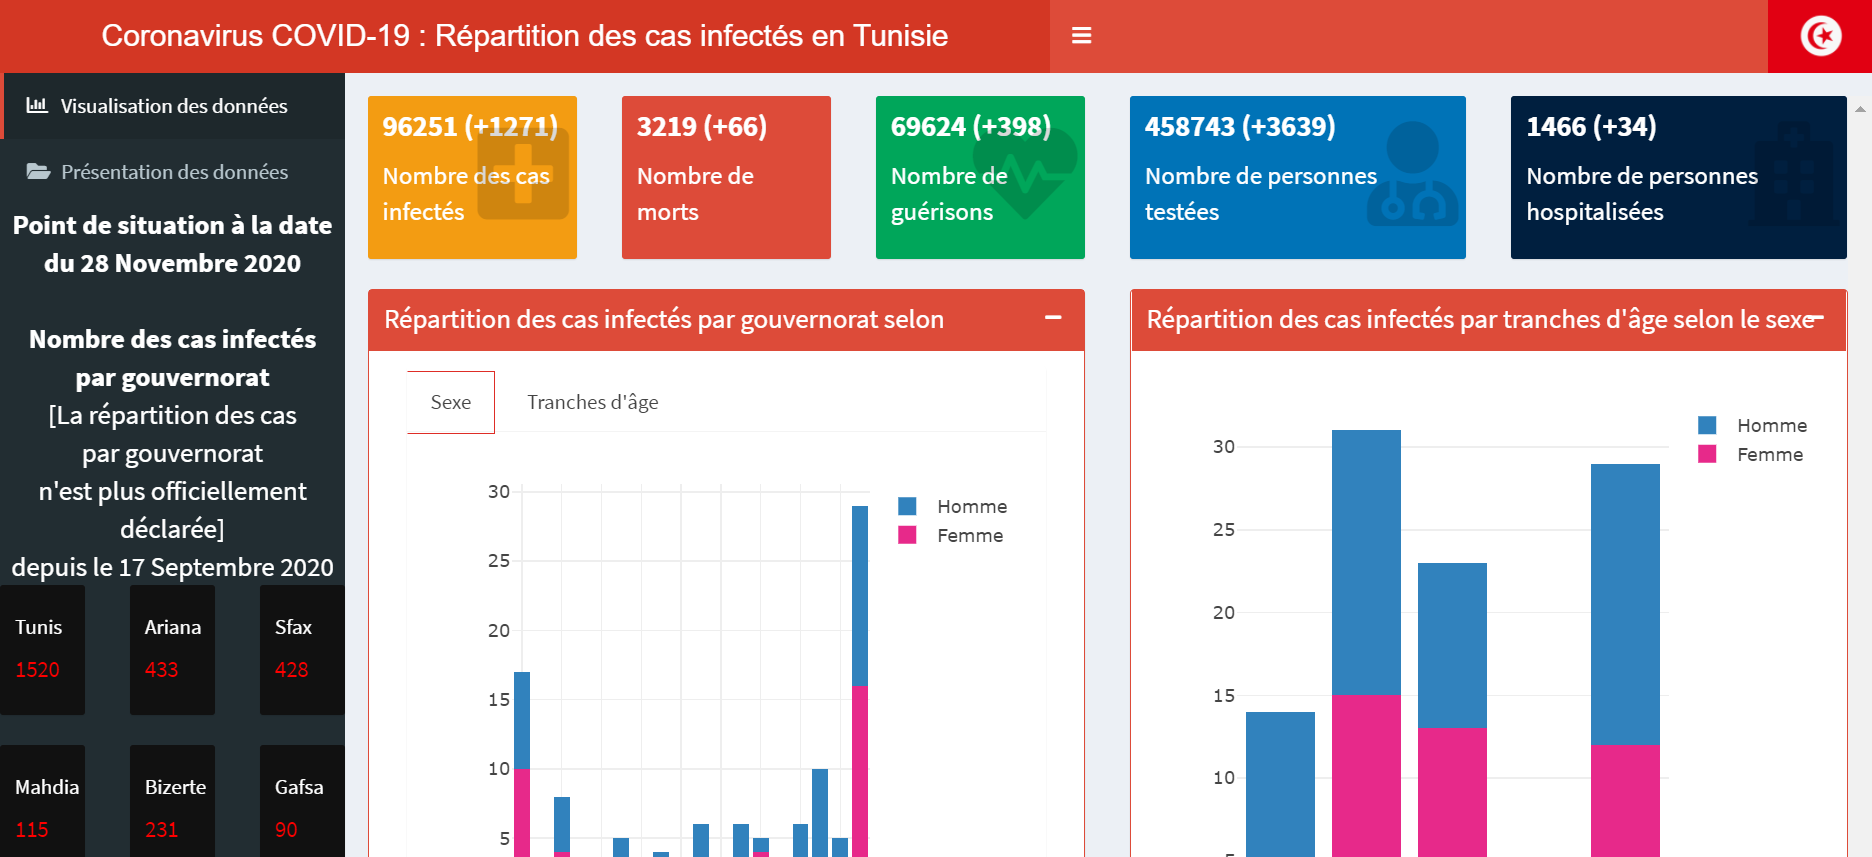
A supporting Shiny Application for the covid19tunisia dataset available here.