Since spectra have been used to investigate the content of a sample, Chemometrics, the field which studies how mathematical and statistical methods can be applied to Chemistry, has been developing several models that are useful to predict concentration of substances of interest.
This technology is widely used because of the fact that it is quick and green, which means that it does not impact the environment and also is not time consuming. On the other hand, ad hoc methods are needed to explore high dimensional data and Partial Least Squares Regression (PLS) is one the most used models.
For years now, researchers have been questioning if spectra in its entirety could be less useful than selecting only smaller regions which might produce better predictions. From this, the intent of this package, which aims at dividing spectra in windows, which are used in PLS as predictors and then compared to the complete spectra, to see if there are improvements. In this package there are three possible modes:
wpls, which stands for Windows PLS, divides the original spectra into several windows, computes PLS and stores metrics of interest such as RMSE and R2 for calibration and cross-validation both.
ewpls, which stands for Evolving Window PLS, divides the original spectra into several windows, but each new window incorporates the previous ones, so that we are comparing smaller windows with the entire spectra.
swpls, which stands for Sliding Window PLS, asks the width of the window that will be used to compute the model and the step that the window will make forward in the spectra so that a new model is calculated. In this way the window slides along spectra and computes several models, which will be compared with metrics.
You can install the development version of windows.pls like so:
install_github("egonzato/windows.pls")This is a basic example which shows you how to use this package:
library(windows.pls)
data("beer")
conc=unlist(beer[,1])
spectra=beer[,2:ncol(beer)]
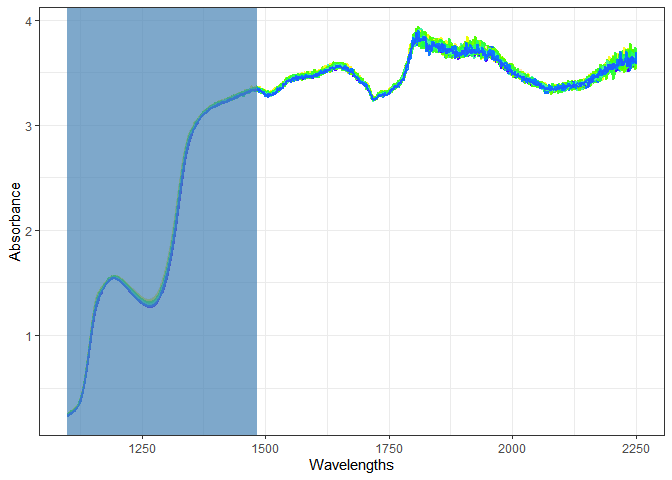
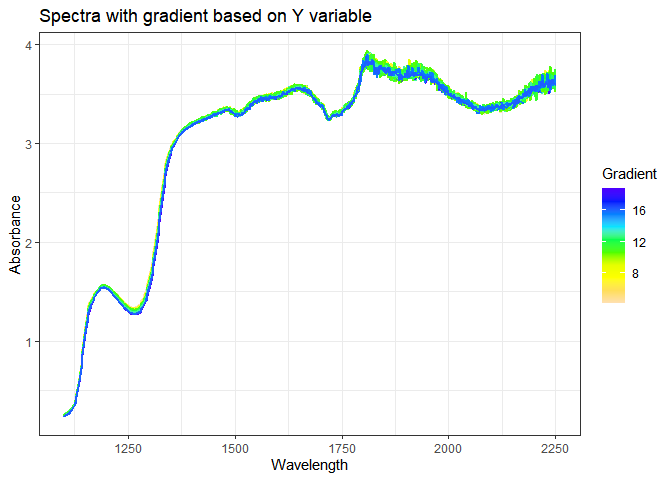
names(spectra)=convert.names.wl(1100,2250,2)Let’s plot our specta mapping them with respect to the associated concentration:
map.spectra.gradient(spectra,conc)
Now, let’s suppose we would like to test three different windows, how would those look like?
segment.windows(spectra, conc, windows = 3)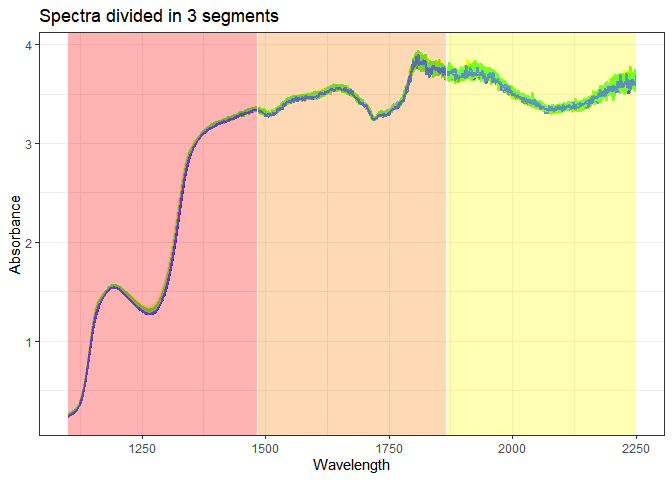
Now, we should divide our dataset into training and testing:
set.seed(181299)
rows=sample(nrow(spectra),round(nrow(spectra)/3))
xtrain=spectra[-rows,]; ytrain=conc[-rows]
xtest=spectra[rows,]; ytest=conc[rows]
names(xtrain)=convert.names.wl(1100,2250,2)
names(xtest)=convert.names.wl(1100,2250,2)
Let’s compute a model with three windows:
mywpls=cv.wpls(xtrain,ytrain,mode = 'wpls', windows = 3)Now, to compare the four possible models, we can plot RMSE of calibration and cross-validation for each of them, in a single window:
global.rmse(mywpls)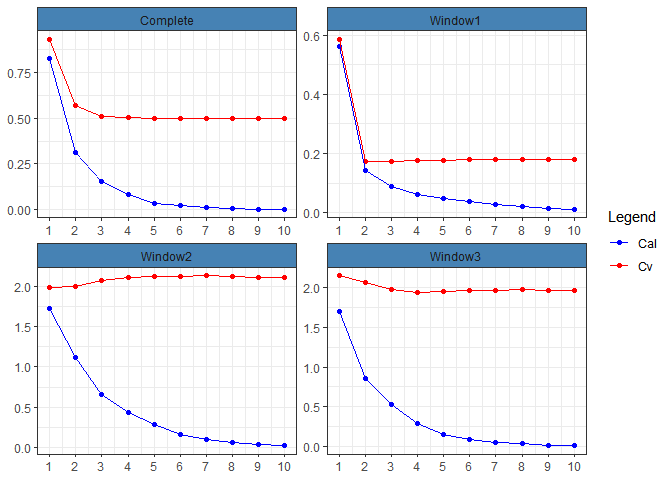
In this case, the second model, which refers to the first window, has the lowest value in cross-validation, so we can select that model and store its metrics:
best.window=sel.best.window(mywpls)
#> [1] "The best model is the Window1 model which has range X1100:X1484"
We can also plot spectra highlighting the selected window:
map.best.window(mywpls)