
The goal of reportRmd is to automate the reporting of clinical data in Quarto/Rmarkdown environments. Functions include table one-style summary statistics, compilation of multiple univariate models, tidy output of multivariable models and side by side comparisons of univariate and multivariable models. Plotting functions include customisable survival curves, forest plots, and automated bivariate plots.
Installing from CRAN:
install.packages('reportRmd')For users on Windows R 4.5+:
Changes to the handling of Dates causes an error when summarising date variables in rm_covsum. Please install the development version.
pak::pak("biostatsPMH/reportRmd@development", upgrade = TRUE)rm_mvsum() and forestplotMV() now support
include_unadjusted=TRUE to display univariate (unadjusted)
and multivariable (adjusted) estimates side-by-sideforestplotMV() data parameter is now optional - data
extracted automatically from model objectslibrary(reportRmd)
data("pembrolizumab")
rm_covsum(data=pembrolizumab, maincov = 'sex',
covs=c('age','pdl1','change_ctdna_group'),
show.tests=TRUE)| Full Sample (n=94) | Female (n=58) | Male (n=36) | p-value | StatTest | |
|---|---|---|---|---|---|
| Age at study entry | 0.30 | Wilcoxon Rank Sum | |||
| Mean (sd) | 57.9 (12.8) | 56.9 (12.6) | 59.3 (13.1) | ||
| Median (Min,Max) | 59.1 (21.1, 81.8) | 56.6 (34.1, 78.2) | 61.2 (21.1, 81.8) | ||
| PD L1 percent | 0.76 | Wilcoxon Rank Sum | |||
| Mean (sd) | 13.9 (29.2) | 15.0 (30.5) | 12.1 (27.3) | ||
| Median (Min,Max) | 0 (0, 100) | 0.5 (0.0, 100.0) | 0 (0, 100) | ||
| Missing | 1 | 0 | 1 | ||
| Did ctDNA increase or decrease from baseline to cycle 3 | 0.84 | Chi Sq | |||
| Decrease from baseline | 33 (45) | 19 (48) | 14 (42) | ||
| Increase from baseline | 40 (55) | 21 (52) | 19 (58) | ||
| Missing | 21 | 18 | 3 |
pembrolizumab |> rm_compactsum( grp = 'sex',
xvars=c('age','pdl1','change_ctdna_group'))| Full Sample (n=94) | Female (n=58) | Male (n=36) | p-value | Missing | |
|---|---|---|---|---|---|
| Age at study entry | 59.1 (49.5-68.7) | 56.6 (45.8-67.8) | 61.2 (52.0-69.4) | 0.30 | 0 |
| PD L1 percent | 0.0 (0.0-10.0) | 0.5 (0.0-13.8) | 0.0 (0.0-4.5) | 0.76 | 1 |
| Did ctDNA increase or decrease from baseline to cycle 3 - Increase from baseline | 40 (55%) | 21 (52%) | 19 (58%) | 0.84 | 21 |
As of v0.1.3 you can now use xvars and grp
as aliases for covs and maincov in rm_covsum.
rm_covsum(data=pembrolizumab, grp = 'sex',
xvars=c('age','pdl1','change_ctdna_group'),
show.tests=TRUE)| Full Sample (n=94) | Female (n=58) | Male (n=36) | p-value | StatTest | |
|---|---|---|---|---|---|
| Age at study entry | 0.30 | Wilcoxon Rank Sum | |||
| Mean (sd) | 57.9 (12.8) | 56.9 (12.6) | 59.3 (13.1) | ||
| Median (Min,Max) | 59.1 (21.1, 81.8) | 56.6 (34.1, 78.2) | 61.2 (21.1, 81.8) | ||
| PD L1 percent | 0.76 | Wilcoxon Rank Sum | |||
| Mean (sd) | 13.9 (29.2) | 15.0 (30.5) | 12.1 (27.3) | ||
| Median (Min,Max) | 0 (0, 100) | 0.5 (0.0, 100.0) | 0 (0, 100) | ||
| Missing | 1 | 0 | 1 | ||
| Did ctDNA increase or decrease from baseline to cycle 3 | 0.84 | Chi Sq | |||
| Decrease from baseline | 33 (45) | 19 (48) | 14 (42) | ||
| Increase from baseline | 40 (55) | 21 (52) | 19 (58) | ||
| Missing | 21 | 18 | 3 |
rm_compactsum(data=pembrolizumab, grp = 'sex',
xvars=c('age','pdl1','change_ctdna_group'),
show.tests=TRUE)| Full Sample (n=94) | Female (n=58) | Male (n=36) | p-value | Missing | pTest | |
|---|---|---|---|---|---|---|
| Age at study entry | 59.1 (49.5-68.7) | 56.6 (45.8-67.8) | 61.2 (52.0-69.4) | 0.30 | 0 | Wilcoxon Rank Sum |
| PD L1 percent | 0.0 (0.0-10.0) | 0.5 (0.0-13.8) | 0.0 (0.0-4.5) | 0.76 | 1 | Wilcoxon Rank Sum |
| Did ctDNA increase or decrease from baseline to cycle 3 - Increase from baseline | 40 (55%) | 21 (52%) | 19 (58%) | 0.84 | 21 | ChiSq |
var_names <- data.frame(var=c("age","pdl1","change_ctdna_group"),
                          label=c('Age at study entry',
                                  'PD L1 percent',
                                  'ctDNA change from baseline to cycle 3'))

pembrolizumab <- set_labels(pembrolizumab,var_names)

rm_covsum(data=pembrolizumab, maincov = 'sex',
covs=c('age','pdl1','change_ctdna_group'))| Full Sample (n=94) | Female (n=58) | Male (n=36) | p-value | |
|---|---|---|---|---|
| Age at study entry | 0.30 | |||
| Mean (sd) | 57.9 (12.8) | 56.9 (12.6) | 59.3 (13.1) | |
| Median (Min,Max) | 59.1 (21.1, 81.8) | 56.6 (34.1, 78.2) | 61.2 (21.1, 81.8) | |
| PD L1 percent | 0.76 | |||
| Mean (sd) | 13.9 (29.2) | 15.0 (30.5) | 12.1 (27.3) | |
| Median (Min,Max) | 0 (0, 100) | 0.5 (0.0, 100.0) | 0 (0, 100) | |
| Missing | 1 | 0 | 1 | |
| ctDNA change from baseline to cycle 3 | 0.84 | |||
| Decrease from baseline | 33 (45) | 19 (48) | 14 (42) | |
| Increase from baseline | 40 (55) | 21 (52) | 19 (58) | |
| Missing | 21 | 18 | 3 |
rm_uvsum(data=pembrolizumab, response='orr',
covs=c('age','pdl1','change_ctdna_group'))| OR(95%CI) | p-value | N | Event | |
|---|---|---|---|---|
| Age at study entry | 0.96 (0.91, 1.00) | 0.089 | 94 | 78 |
| PD L1 percent | 0.97 (0.95, 0.98) | <0.001 | 93 | 77 |
| ctDNA change from baseline to cycle 3 | 73 | 58 | ||
| Decrease from baseline | Reference | 33 | 19 | |
| Increase from baseline | 28.74 (5.20, 540.18) | 0.002 | 40 | 39 |
glm_fit <- glm(orr~change_ctdna_group+pdl1+age,
               family='binomial',
               data = pembrolizumab)
rm_mvsum(glm_fit,showN=T)| OR(95%CI) | p-value | N | Event | VIF | |
|---|---|---|---|---|---|
| ctDNA change from baseline to cycle 3 | 73 | 58 | 1.03 | ||
| Decrease from baseline | Reference | 33 | 19 | ||
| Increase from baseline | 23.92 (3.69, 508.17) | 0.006 | 40 | 39 | |
| PD L1 percent | 0.97 (0.95, 0.99) | 0.011 | 73 | 58 | 1.24 |
| Age at study entry | 0.94 (0.87, 1.00) | 0.078 | 73 | 58 | 1.23 |
uvsumTable <- rm_uvsum(data=pembrolizumab, response='orr',
covs=c('age','sex','pdl1','change_ctdna_group'),tableOnly = TRUE)

glm_fit <- glm(orr~change_ctdna_group+pdl1,
               family='binomial',
               data = pembrolizumab)
mvsumTable <- rm_mvsum(glm_fit,tableOnly = TRUE)

rm_uv_mv(uvsumTable,mvsumTable)| Unadjusted OR(95%CI) | p | Adjusted OR(95%CI) | p (adj) | |
|---|---|---|---|---|
| Age at study entry | 0.96 (0.91, 1.00) | 0.089 | ||
| sex | ||||
| Female | Reference | |||
| Male | 0.41 (0.13, 1.22) | 0.11 | ||
| PD L1 percent | 0.97 (0.95, 0.98) | <0.001 | 0.98 (0.95, 1.00) | 0.024 |
| ctDNA change from baseline to cycle 3 | ||||
| Decrease from baseline | Reference | Reference | ||
| Increase from baseline | 28.74 (5.20, 540.18) | 0.002 | 24.71 (4.19, 479.13) | 0.004 |
Shows events, median survival, survival rates at different times and the log rank test.
 rm_survsum(data=pembrolizumab,time='os_time',status='os_status',
 group="cohort",survtimes=c(12,24),
 survtimesLbls=c(1,2),
survtimeunit='yr')| Group | Events/Total | Median (95%CI) | 1yr (95% CI) | 2yr (95% CI) |
|---|---|---|---|---|
| A | 12/16 | 8.30 (4.24, Not Estimable) | 0.38 (0.20, 0.71) | 0.23 (0.09, 0.59) |
| B | 16/18 | 8.82 (4.67, 20.73) | 0.32 (0.16, 0.64) | 0.06 (9.6e-03, 0.42) |
| C | 12/18 | 17.56 (7.95, Not Estimable) | 0.61 (0.42, 0.88) | 0.44 (0.27, 0.74) |
| D | 4/12 | Not Estimable (6.44, Not Estimable) | 0.67 (0.45, 0.99) | 0.67 (0.45, 0.99) |
| E | 20/30 | 14.26 (9.69, Not Estimable) | 0.63 (0.48, 0.83) | 0.34 (0.20, 0.57) |
| Log Rank Test | ChiSq | 11.3 on 4 df | ||
| p-value | 0.023 |
library(survival)
data(pbc)
rm_cifsum(data=pbc,time='time',status='status',group=c('trt','sex'),
eventtimes=c(1825,3650),eventtimeunit='day')
#> 106 observations with missing data were removed.| Strata | Event/Total | 1825day (95% CI) | 3650day (95% CI) |
|---|---|---|---|
| 1, f | 7/137 | 0.04 (0.01, 0.08) | 0.06 (0.03, 0.12) |
| 1, m | 3/21 | 0.10 (0.02, 0.27) | 0.16 (0.03, 0.36) |
| 2, f | 9/139 | 0.05 (0.02, 0.09) | 0.09 (0.04, 0.17) |
| 2, m | 0/15 | 0e+00 (NA, NA) | 0e+00 (NA, NA) |
| Gray’s Test | ChiSq | 3.3 on 3 df | |
| p-value | 0.35 |
ggkmcif2(response = c('os_time','os_status'),
cov='cohort',
data=pembrolizumab)
#> Warning: Vectorized input to `element_text()` is not officially supported.
#> ℹ Results may be unexpected or may change in future versions of ggplot2.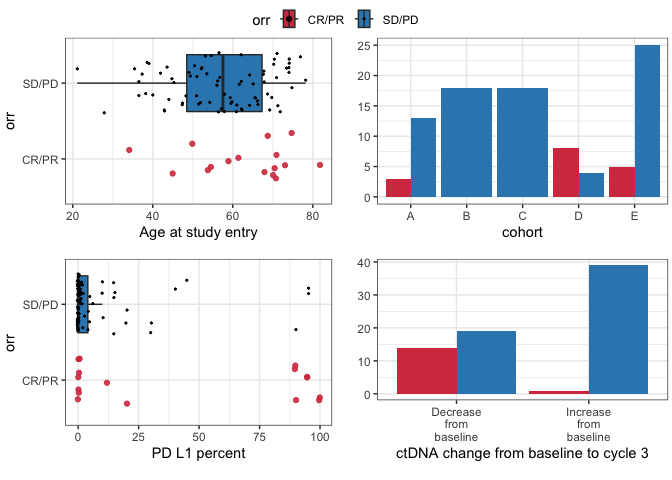
Forest plots can display multivariable results, or include univariate estimates for comparison:
require(ggplot2)
#> Loading required package: ggplot2
# Multivariable only
forestplotMV(glm_fit)
#> Warning: Using `size` aesthetic for lines was deprecated in ggplot2 3.4.0.
#> ℹ Please use `linewidth` instead.
#> ℹ The deprecated feature was likely used in the ggplot2 package.
#>   Please report the issue at <https://github.com/tidyverse/ggplot2/issues>.
#> This warning is displayed once per session.
#> Call `lifecycle::last_lifecycle_warnings()` to see where this warning was
#> generated.
#> Warning: Vectorized input to `element_text()` is not officially supported.
#> ℹ Results may be unexpected or may change in future versions of ggplot2.
#> Note: Very wide confidence intervals detected. X-axis capped for readability.
#> `height` was translated to `width`.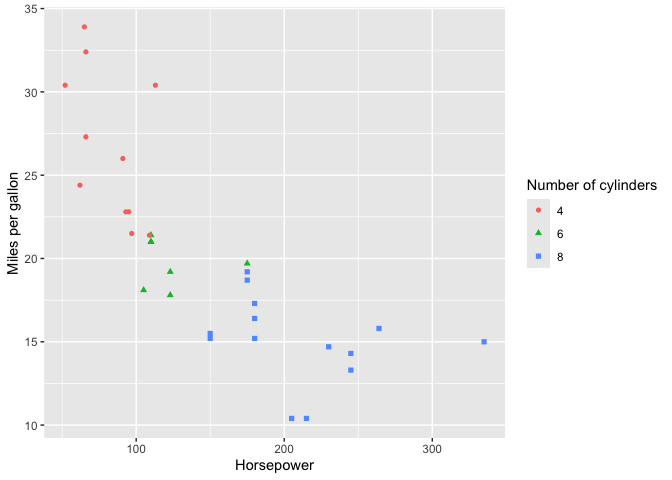
# With unadjusted estimates
forestplotMV(glm_fit, data = pembrolizumab, include_unadjusted = TRUE)
#> Fitting univariate models for each predictor
#> Note: Adjusted model N=73 may differ from unadjusted model N=93 due to missing data in covariates
#> Warning: Vectorized input to `element_text()` is not officially supported.
#> ℹ Results may be unexpected or may change in future versions of ggplot2.
#> Note: Very wide confidence intervals detected. X-axis capped for readability.
#> `height` was translated to `width`.
These plots are designed for quick inspection of many variables, not for publication.
require(ggplot2)
plotuv(data=pembrolizumab, response='orr',
covs=c('age','cohort','pdl1','change_ctdna_group'))
#> Boxplots not shown for categories with fewer than 20 observations.
#> Boxplots not shown for categories with fewer than 20 observations.
data("mtcars")
mtcars <- mtcars |>
  dplyr::mutate(cyl = as.factor(cyl)) |>
  set_labels(data.frame(var=c("hp","mpg","cyl"),
                        label=c('Horsepower',
                                'Miles per gallon',
                                'Number of cylinders')))
p <- mtcars |>
ggplot(aes(x=hp, y=mpg, color=cyl, shape=cyl)) +
    geom_point()
replace_plot_labels(p)